Test Execution
Starting an execution
To execute a test case, open a test plan and click the Run button next to the test case you want to execute. This opens the execution runner, which guides you through each step.
You can also start an execution from the test case detail panel by clicking Execute.
Step-by-step execution runner
The execution runner displays each test step with its action, expected result, and test data. For each step, you record the outcome:
| Result | Meaning |
|---|---|
| Pass | The step produced the expected result. |
| Fail | The step did not produce the expected result. |
| Blocked | The step could not be executed due to a dependency or blocker. |
| Skip | The step was intentionally skipped (not applicable). |
Click the appropriate result button for each step to record its outcome.
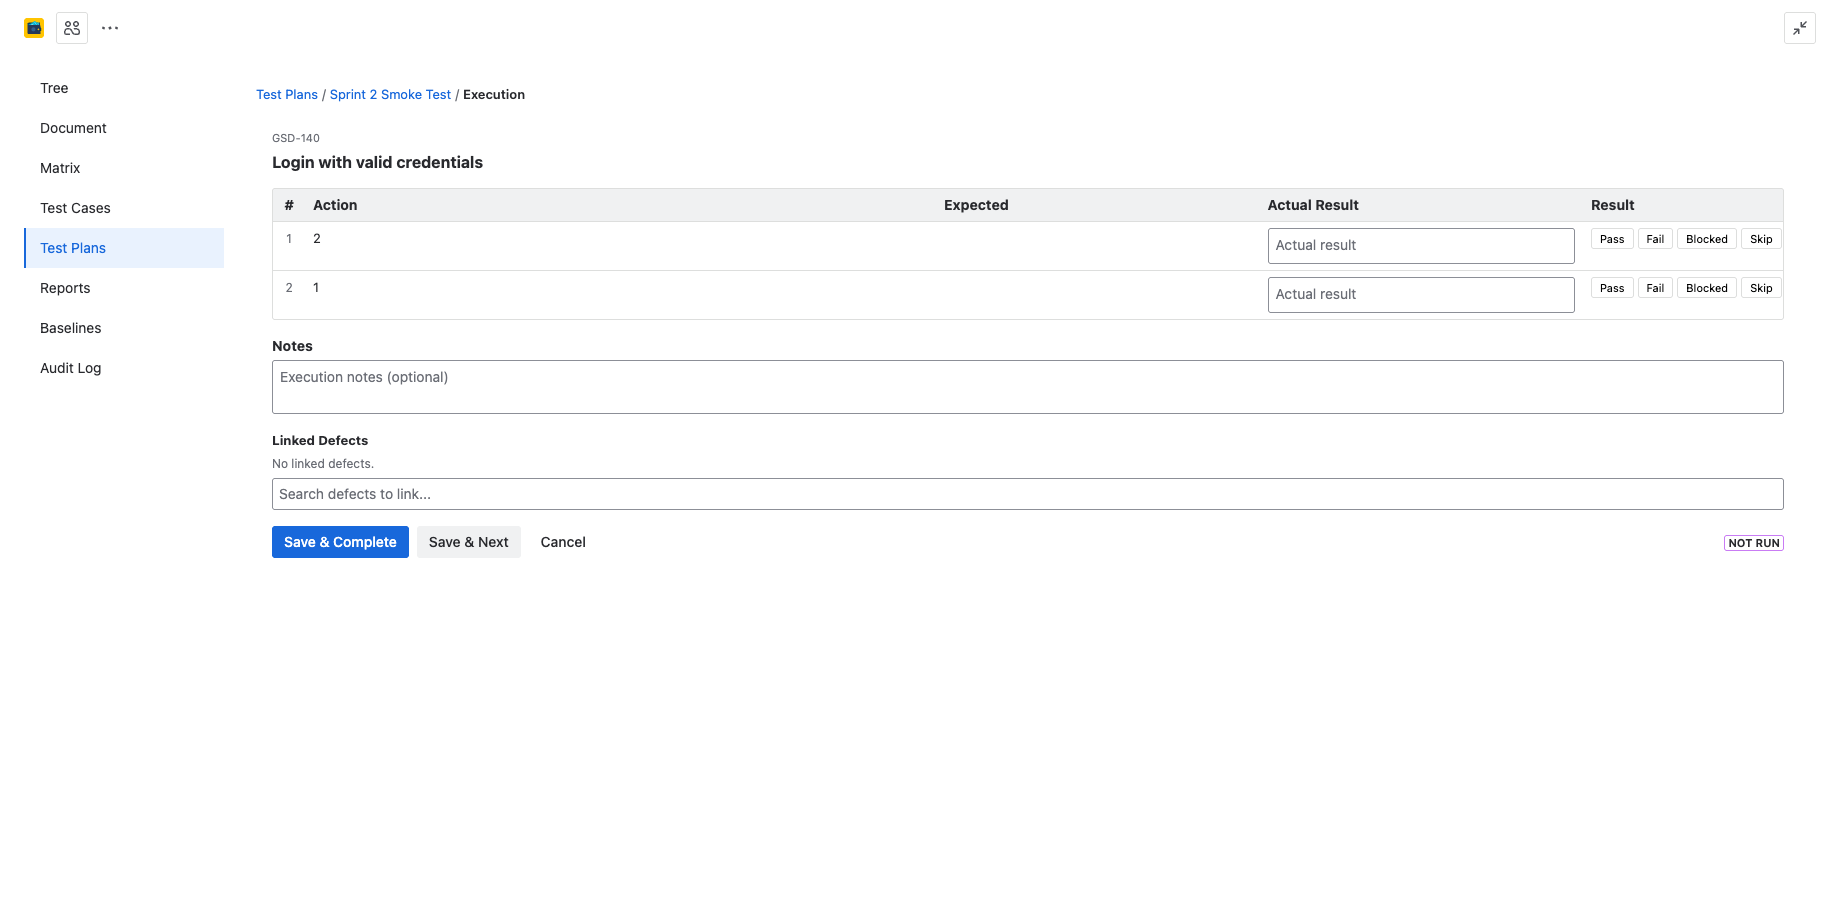
Recording actual results
For each step, you can optionally enter an Actual Result description. This is especially useful for failed or blocked steps, where you want to document what actually happened versus what was expected.
Actual results are saved with the execution record and are visible in execution history and reports.
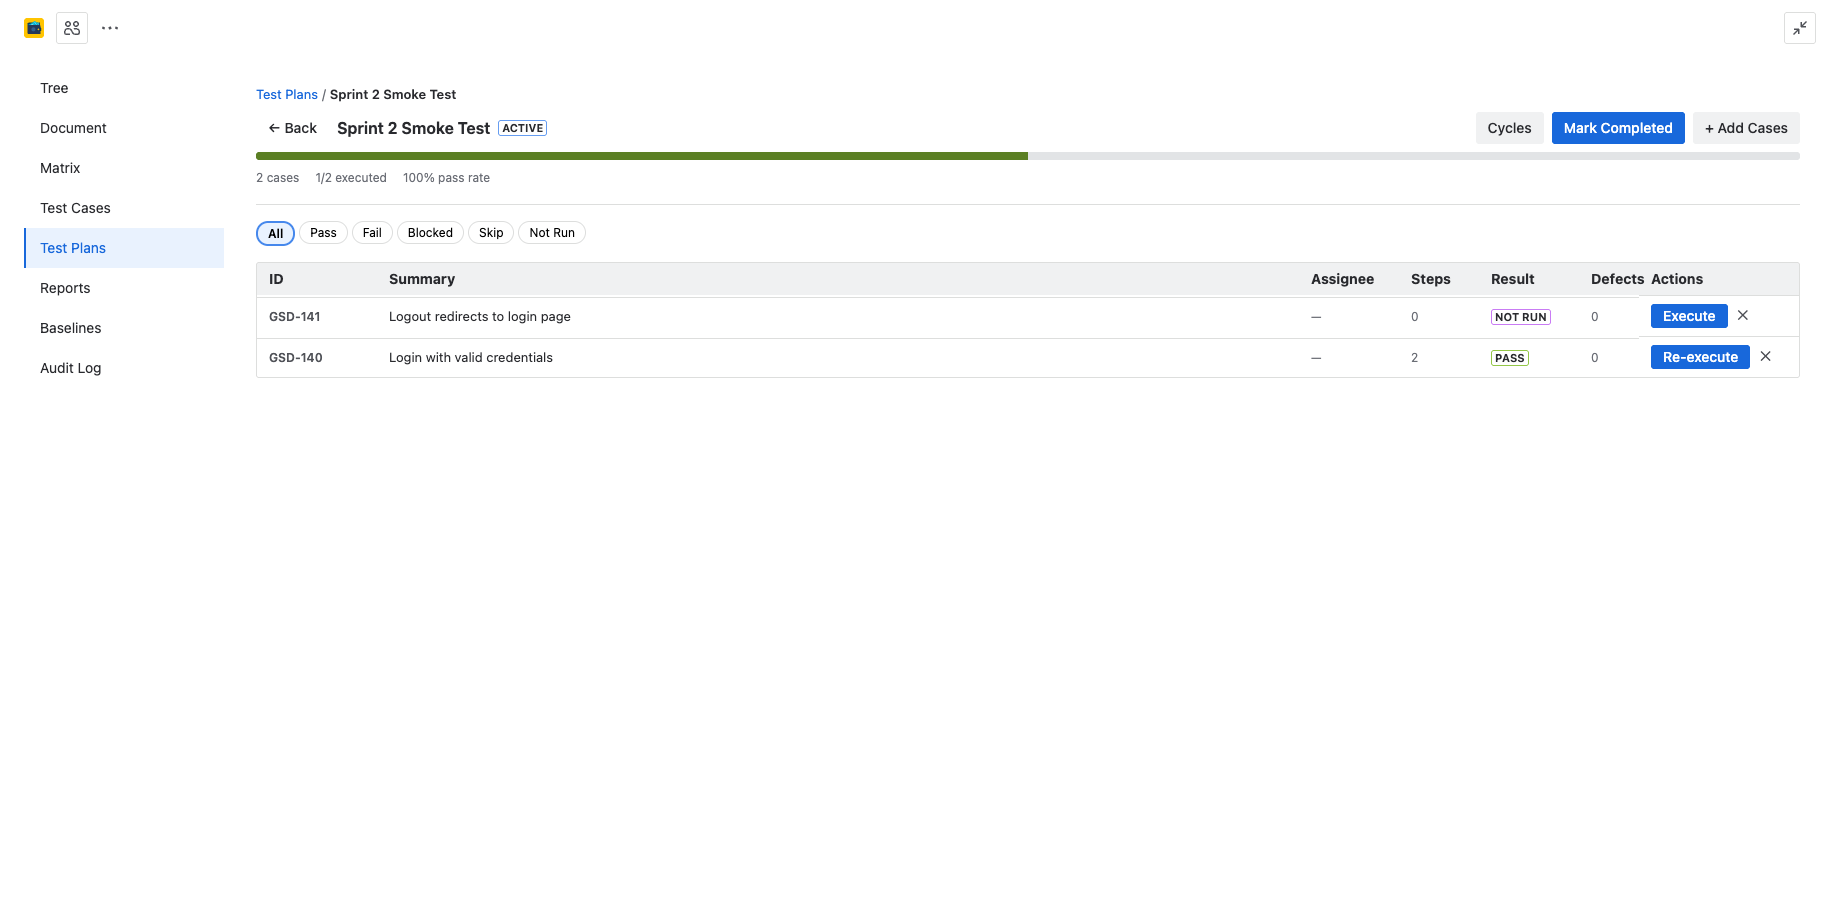
Overall result aggregation
After all steps are completed, the overall execution result is determined automatically:
- If any step is Fail, the overall result is Fail.
- If no steps failed but any step is Blocked, the overall result is Blocked.
- If all steps are Pass or Skip, the overall result is Pass.
You can also override the overall result manually if needed.
Creating defects from failed steps
When a step fails, you can create a Jira bug directly from the execution runner:
- Mark a step as Fail.
- Click the Create Defect button that appears.
- A new Jira bug is pre-populated with the step details (action, expected result, actual result).
- Fill in any additional details and submit.
The defect is automatically linked to the test case and execution record.
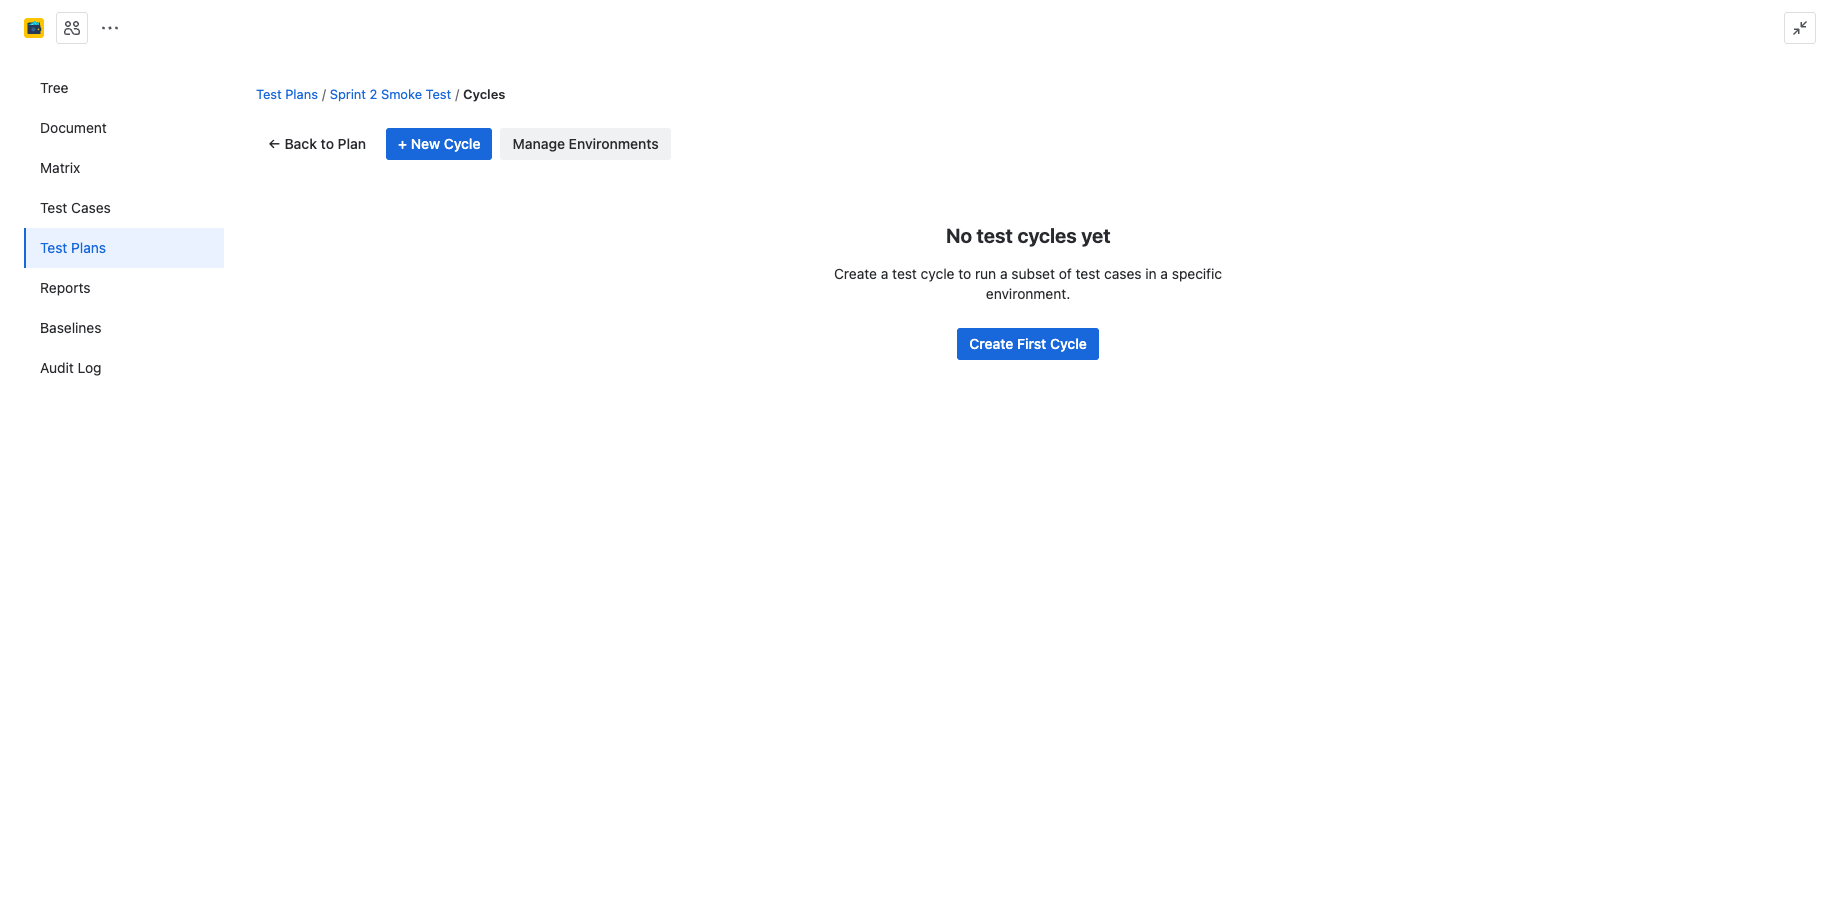
Test cycles
A test cycle is a named execution pass within a test plan. Cycles let you run the same set of test cases multiple times — for example, an initial run, a regression pass, and a final verification.
- Create a cycle: Open a test plan and click + New Cycle. Give it a name (e.g., "Sprint 12 - Round 1").
- Switch cycles: Use the cycle dropdown at the top of the plan to view results for a specific cycle.
- Compare cycles: Use the Cycle Comparison report to see how results changed across cycles.
Each cycle tracks its own execution results independently. Previous cycle results are preserved and accessible from the execution history.
Test environments
Environments represent the systems or configurations where tests are executed (e.g., "Chrome on Windows", "Staging Server", "iOS 17").
- Create environments: Go to project settings and manage environments under the Test Environments section.
- Associate with cycles: When creating or editing a cycle, select the environment it targets.
- Filter by environment: Reports can be filtered by environment to compare results across configurations.
Execution history and re-runs
Every execution is recorded with a run number. When you re-execute a test case within the same cycle, a new run is created rather than overwriting the previous result.
View the full execution history from the test case detail panel under the Executions section. Each run shows the date, tester, cycle, environment, and result.
Defect linking
In addition to creating new bugs from failed steps, you can link existing Jira issues as defects:
- Open an execution record.
- Click Link Defect.
- Search for an existing Jira issue by key or summary.
- Select the issue to link it.
Linked defects are tracked across executions and appear in the Traceability and Compliance reports, providing a complete chain from requirement to defect.
"My Assignments" view
The My Assignments view shows all test cases assigned to you across all active plans. It provides a focused list of your pending work, including:
- Test case summary and TC ID.
- Plan name and cycle.
- Current execution status (Not Run, Pass, Fail, etc.).
- Quick-execute button to jump directly into the runner.
Access My Assignments from the toolbar dropdown in the Test Plans tab.