Global Dashboard
4Spec provides three surfaces for viewing requirements and test data outside of the main project page: a cross-project global dashboard, an embeddable dashboard gadget, and an issue panel for traceability on any Jira issue.
Global Dashboard
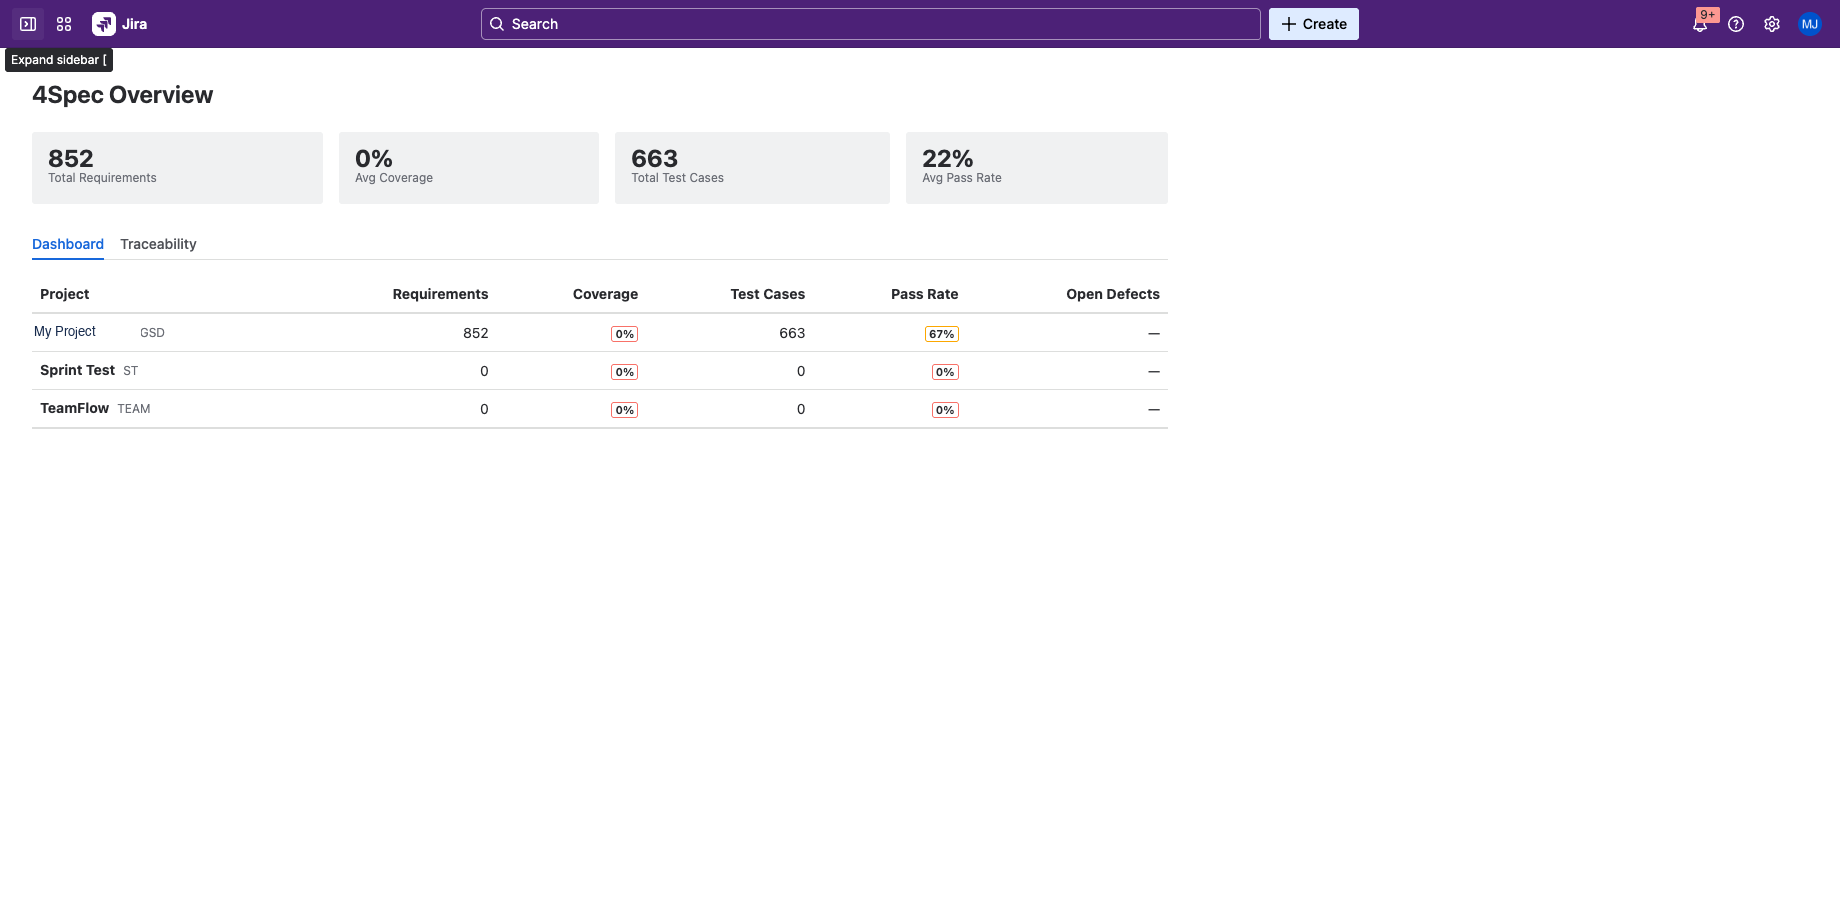
The global dashboard is accessible from the Jira top navigation: Apps → 4Spec. It provides a cross-project overview of requirements and test management KPIs across your entire Jira site.
Aggregated KPI Cards
The top of the dashboard displays four summary cards:
- Total Requirements — the combined count of requirements across all projects that have 4Spec provisioned.
- Average Coverage — the mean coverage percentage across all projects, weighted by requirement count.
- Total Test Cases — the combined count of test cases across all projects.
- Average Pass Rate — the mean pass rate of test executions across all projects.
Per-Project Breakdown Table
Below the KPI cards, a table lists every project with 4Spec enabled. Each row shows:
| Column | Description |
|---|---|
| Project | The project name and key, linked to the project's 4Spec page. |
| Requirements | Total number of requirements in the project. |
| Coverage | Percentage of requirements linked to at least one implementation issue. |
| Test Cases | Total number of test cases in the project. |
| Pass Rate | Percentage of test executions with a Pass result. |
| Approved | Number of requirements in Approved state (if approval workflow is enabled). |
Click any project row to navigate directly to that project's 4Spec page.
Dashboard Gadget
4Spec includes a Jira dashboard gadget that you can add to any Jira dashboard, giving stakeholders a quick view of requirements and testing KPIs without opening the full 4Spec app.
Adding to a Jira Dashboard
- Open any Jira dashboard and click Add gadget.
- Search for 4Spec in the gadget directory.
- Click Add to place the gadget on your dashboard.
KPI Cards Displayed
The gadget displays the same four aggregated KPI cards as the global dashboard: total requirements, average coverage, total test cases, and average pass rate. It provides a compact, at-a-glance summary suitable for management dashboards.
Auto-Refresh
The gadget automatically refreshes its data each time the Jira dashboard is loaded. No manual refresh is needed — the KPIs always reflect the current state of your projects.
Issue Panel
4Spec adds a traceability panel to the Jira issue view. This panel appears on any Jira issue — not just requirements and test cases — and shows how that issue relates to 4Spec data.
What the Panel Shows
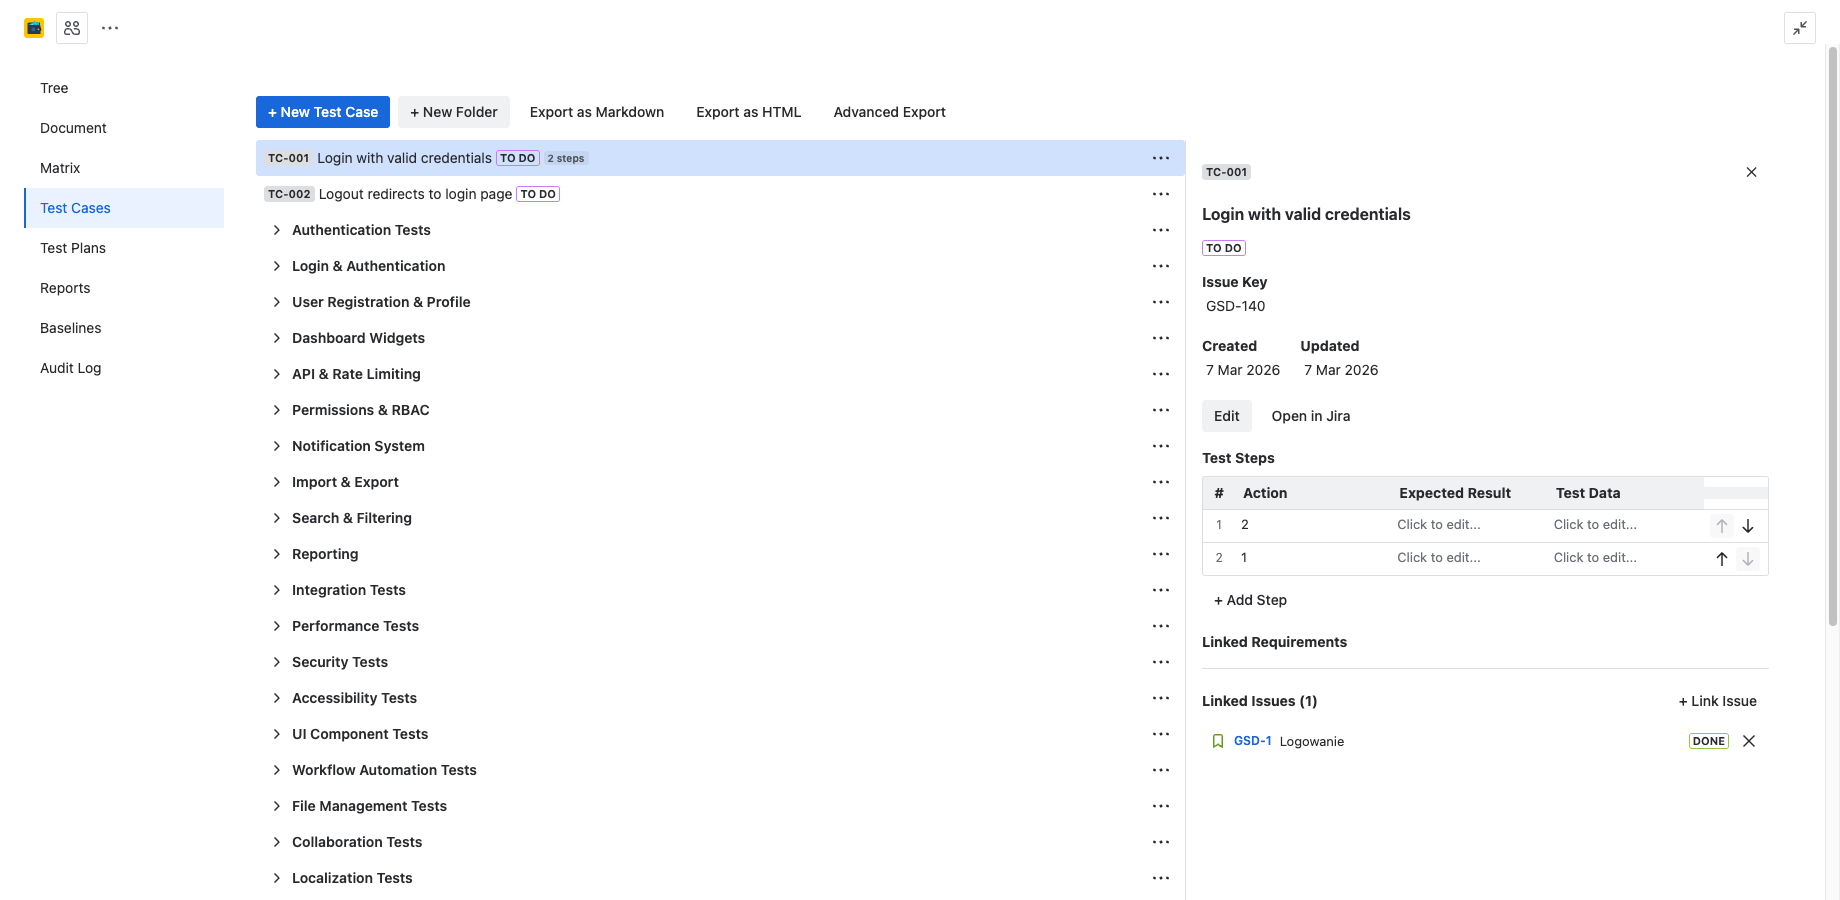
When you open any Jira issue, the 4Spec panel displays:
- Linked Requirements — any 4Spec requirements that are linked to this issue via "requires" or "tests" link types. Each requirement shows its ID, summary, and approval status.
- Linked Test Cases — any 4Spec test cases linked to this issue. Each test case shows its ID, summary, and latest execution result.
If the issue has no 4Spec links, the panel displays a message indicating no traceability data is available.
Quick Navigation
From the issue panel, you can:
- Click a requirement ID to navigate to that requirement in the 4Spec tree view.
- Click a test case ID to navigate to that test case in the 4Spec test cases tab.
- Click View in Matrix to open the traceability matrix filtered to the linked requirement.
This makes it easy to check traceability without leaving the issue you are working on.
Next Steps
- Admin & Settings — configure global defaults and project-level overrides.
- Traceability — learn about the traceability matrix and coverage tracking.
- Reports — generate detailed reports for individual projects.